Sabrina-Rodriguez-Portfolio
| Home Page | Projects On Tableau | Visualizing Government Debt | Critique By Design | Drafting Final Project Idea | Refining Final Project | Final Project |
Data visualization examples
Top 3 Countries by Debt-to-GDP Ratio Compared to Global Trends (1995–2019)
This visualization highlights the three countries with the highest average debt-to-GDP ratios from 1995 to 2019, showing how they compare against overall global debt trends.
Source: https://www.oecd.org/en/data/indicators/general-government-debt.html Accessed on September 6, 2025

Average Tract Cancer-Risk Percentile (AirToxScreen/RSEI): Cancer Alley vs. Rest of Louisiana
This chart compares average modeled cancer-risk percentiles between tracts located in Louisiana’s Cancer Alley corridor and those in the rest of the state, revealing a clear concentration of elevated risk in the industrial corridor.

U.S. Petrochemical Market Volume by Product: 2017 Actual vs. 2027 Forecast (MMT)
This bar chart compares actual U.S. petrochemical production volumes in 2017 with projected 2027 levels, showing strong expected growth in ethylene, propylene, and benzene output.
Source: https://www.statista.com/statistics/1098199/us-petrochemical-market-size-by-product/
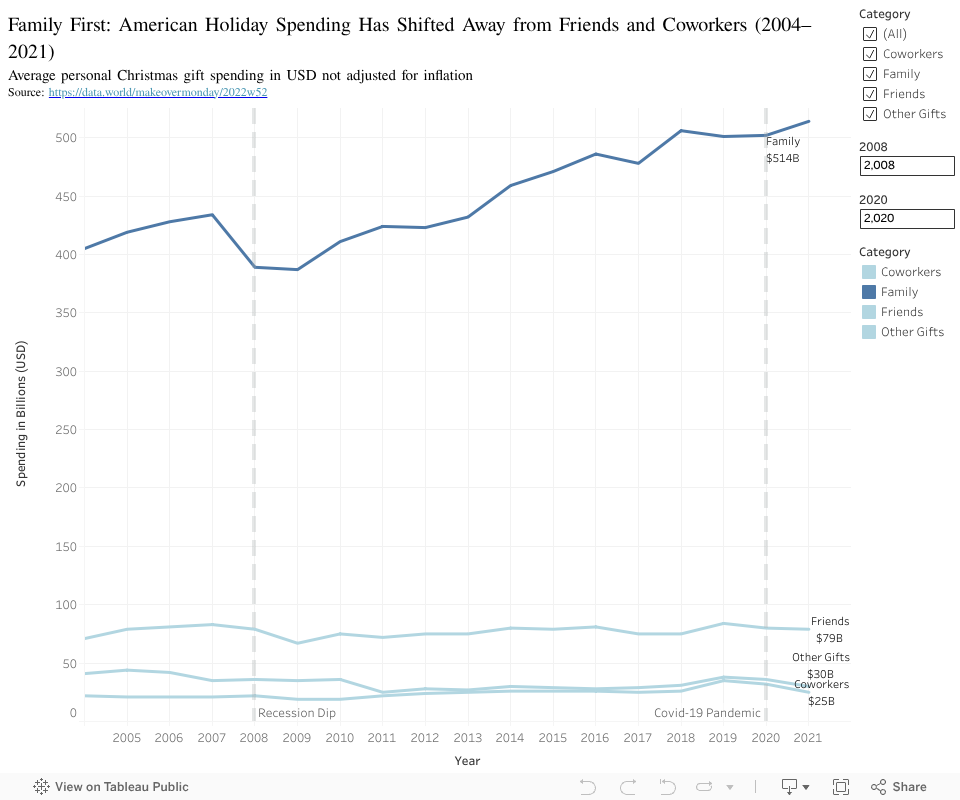
Family First: How American Holiday Spending Shifted from Friends and Coworkers to Family (2004–2021)